Municipal
Defensible numbers from your own data.
AquaMesh works from the history a utility already keeps, derives energy from measured signals rather than assumptions, and shows its working for every number it produces.
- Reads
- Historian tags — flow, pressure, airflow, runtime, quality, totalisers
- Connects to
- SCADA, PLC, historian, CMMS, LIMS
- To start
- A data export. No procurement, no install
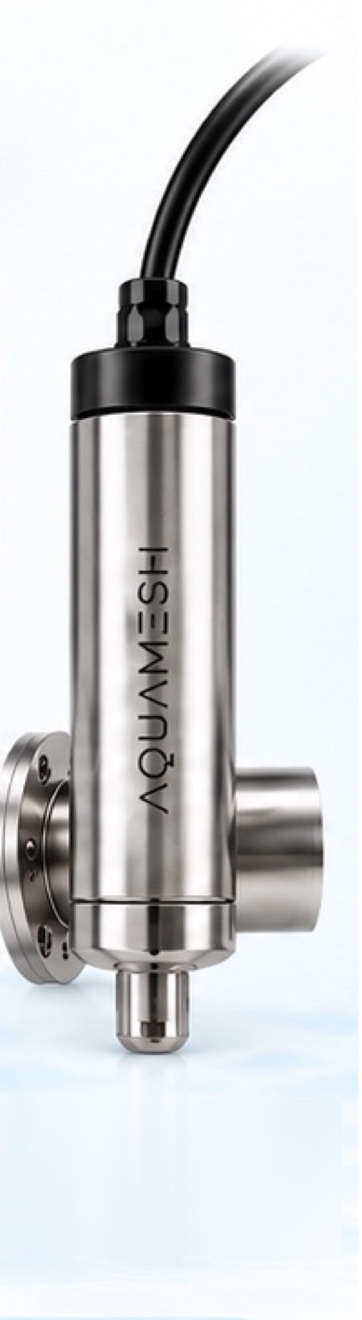
AquaSpectra™ smart probe
Continuous context behind the numbers you report.
A utility is judged on load, solids and compliance. AquaSpectra watches the spectrum move continuously and ties it to those numbers, with BOD calibrated to the lab you already run.
- Change analysis, not a parameter list The platform watches the whole fingerprint move and correlates it with the variables a utility actually reports on.
- Organic load, seen as it shifts A change in the spectral signature flags load moving through the works long before a scheduled sample would.
- BOD calibrated to your own samples The one parameter we calibrate, built against your lab so reported values keep their provenance.
- Unattended between samples Reagent-free and in-situ, which matters when the nearest operator is covering several sites.
- Reads for
- Spectral change across the full fingerprint, correlated to load and process state — with BOD calibrated to your samples
- Typically sits on
- Influent, secondary effluent, reuse distribution and final discharge
What we find
Where a utility’s money usually goes.
These four turn up in most systems we look at. The examples beneath each are the shapes they take in municipal water — your own data decides which are real at your system.
-
Energy and water going where they are not needed
Energy is usually the largest controllable cost a utility has, and most of it is spent by equipment holding a setting.
- Aeration held above the range the plant itself posts
- Reuse water going to disposal because the volumes are not recorded
-
Parallel equipment drifting apart
Lead and lag assets that never swap wear at very different rates, and the standby is the one you will need.
- Lead and lag pumps that have not alternated in years
- Parallel trains with run hours that diverged long ago
-
Setpoints inherited rather than chosen
The reasoning behind a setting often retires with the operator who made it.
- Settings unchanged since commissioning, with nobody left to explain them
- Pumping duty landing inside the expensive hours
-
Instruments that stopped telling the truth
Reporting rests on instruments, and a dead one is invisible until somebody asks for the number.
- Totalisers that stopped moving weeks ago
- Two instruments on the same stream that disagree
What you actually get
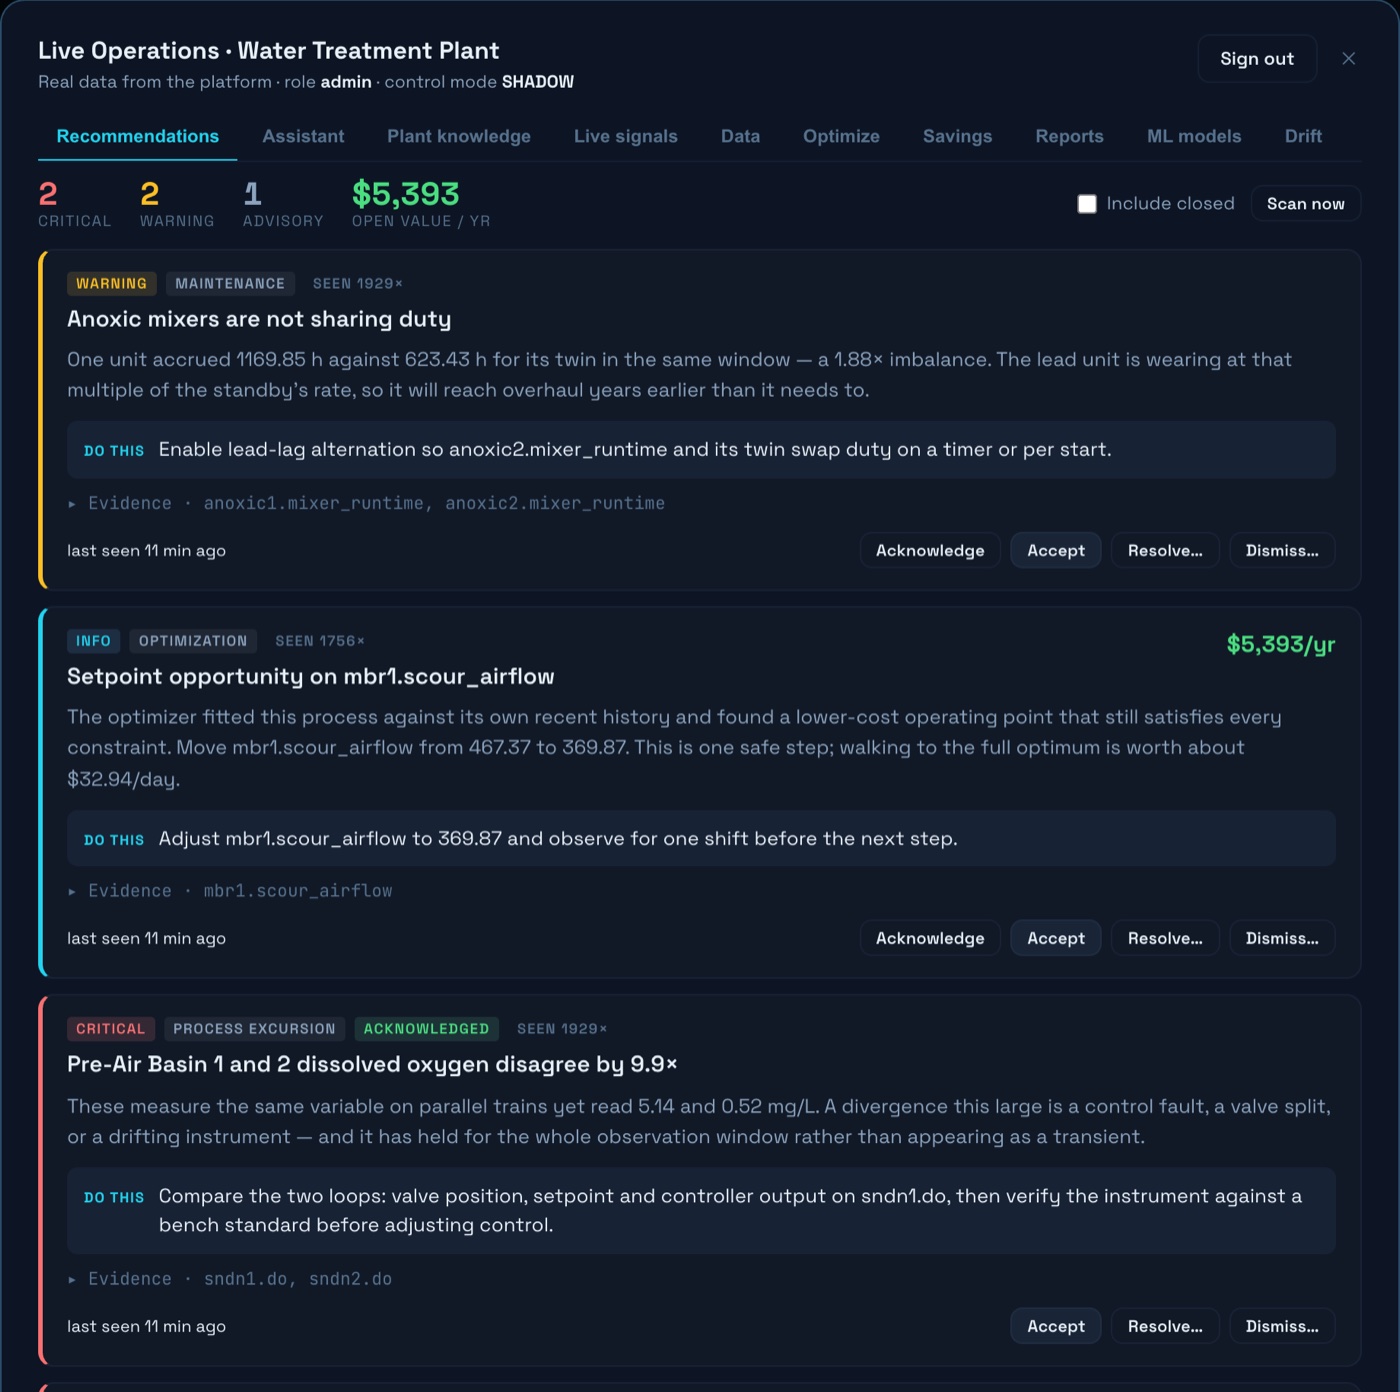
A ranked list of things to do, each with a number on it.
Not a dashboard to interpret. Findings arrive with the action, the tags that are the evidence, and what the change is worth a year — to accept, resolve or dismiss.
Working together
Built for your plant, not from a preset.
- 1
Free audit
Free, on your historian export. No procurement, no install.
- 2
Your process, modelled
Against your posted operating ranges and your actual tariff schedule.
- 3
Sensing where it pays
Capital priced item by item and kept separate, so a request stands on its own.
- 4
You stay in control
Advisory by default, clamped to limits your engineers set, every approval logged.
Start with the data you already report.
Your historian holds most of it. The audit is free and needs no hardware.
Capabilities described here are general. Figures in the linked case study come from one anonymized audit and are specific to that plant and its tariff.