Data Centers
The water side, measured like the power side.
Power is metered to the watt. AquaMesh brings the cooling circuit up to something closer to that — continuous chemistry instead of periodic checks, tied to load and weather.
- Reads
- UV/Vis spectra, conductivity context, solids, organic load
- Connects to
- BMS, historian, water-treatment and service records
- To start
- A make-up analysis and existing tower records
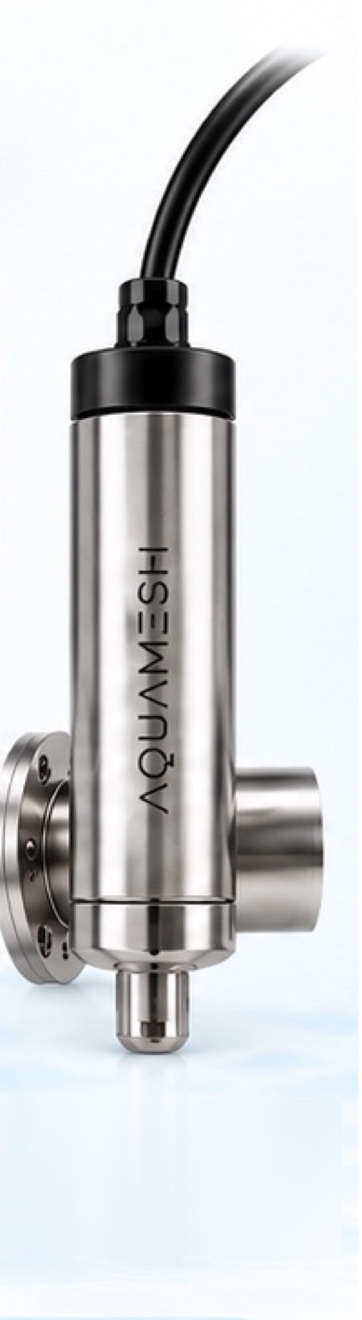
AquaSpectra™ smart probe
The half of tower chemistry a conductivity probe misses.
Conductivity drives most blowdown decisions, but it cannot separate a benign ion from the organic load that drives biocide demand. AquaSpectra reads that half continuously.
- Organic load and fouling indication The load that drives biocide demand and biological fouling, visible continuously rather than at the next service visit.
- Solids and turbidity in the circuit What is actually suspended in the water, which matters for both heat transfer and filtration.
- Context for the conductivity you already trust Your conductivity, flow and existing scaling analysis stay in place — this adds the organic picture beside them.
- Reagent-free and unattended No consumables and no sample line, on a circuit that is typically visited monthly at best.
- Reads for
- Spectral change correlated to organic load and fouling — alongside your existing conductivity and scaling analysis
- Typically sits on
- Tower circuits, make-up lines, blowdown lines and discharge points
What we find
Where the water side usually leaks value.
These four turn up in most sites we look at. The examples beneath each are the shapes they take on a cooling circuit — your own data decides which are real at your site.
-
Treated water discharged on a schedule
Blowdown driven by a clock throws away water you have already paid to treat and dose, then buys make-up to replace it.
- Blowdown triggered on time rather than on the state of the circuit
- Cycles held at a number chosen years ago rather than the achievable one
-
Parallel equipment drifting apart
Towers and chillers on the same duty should behave alike under the same load.
- Parallel towers behaving differently on identical IT load
- Chillers sharing duty unevenly without anyone noticing
-
Programmes that cover a worst case daily
Where demand is invisible between service visits, the chemical programme has to assume the worst.
- Inhibitor and biocide dosed to a recipe rather than to measured demand
- Settings unchanged since the last water-treatment contract was signed
-
Instruments that stopped telling the truth
A drifting probe on a cooling circuit is expensive in both directions — wasted water, or scale.
- A conductivity probe drifting unnoticed between visits
- Meters on the same line that no longer agree
What you actually get
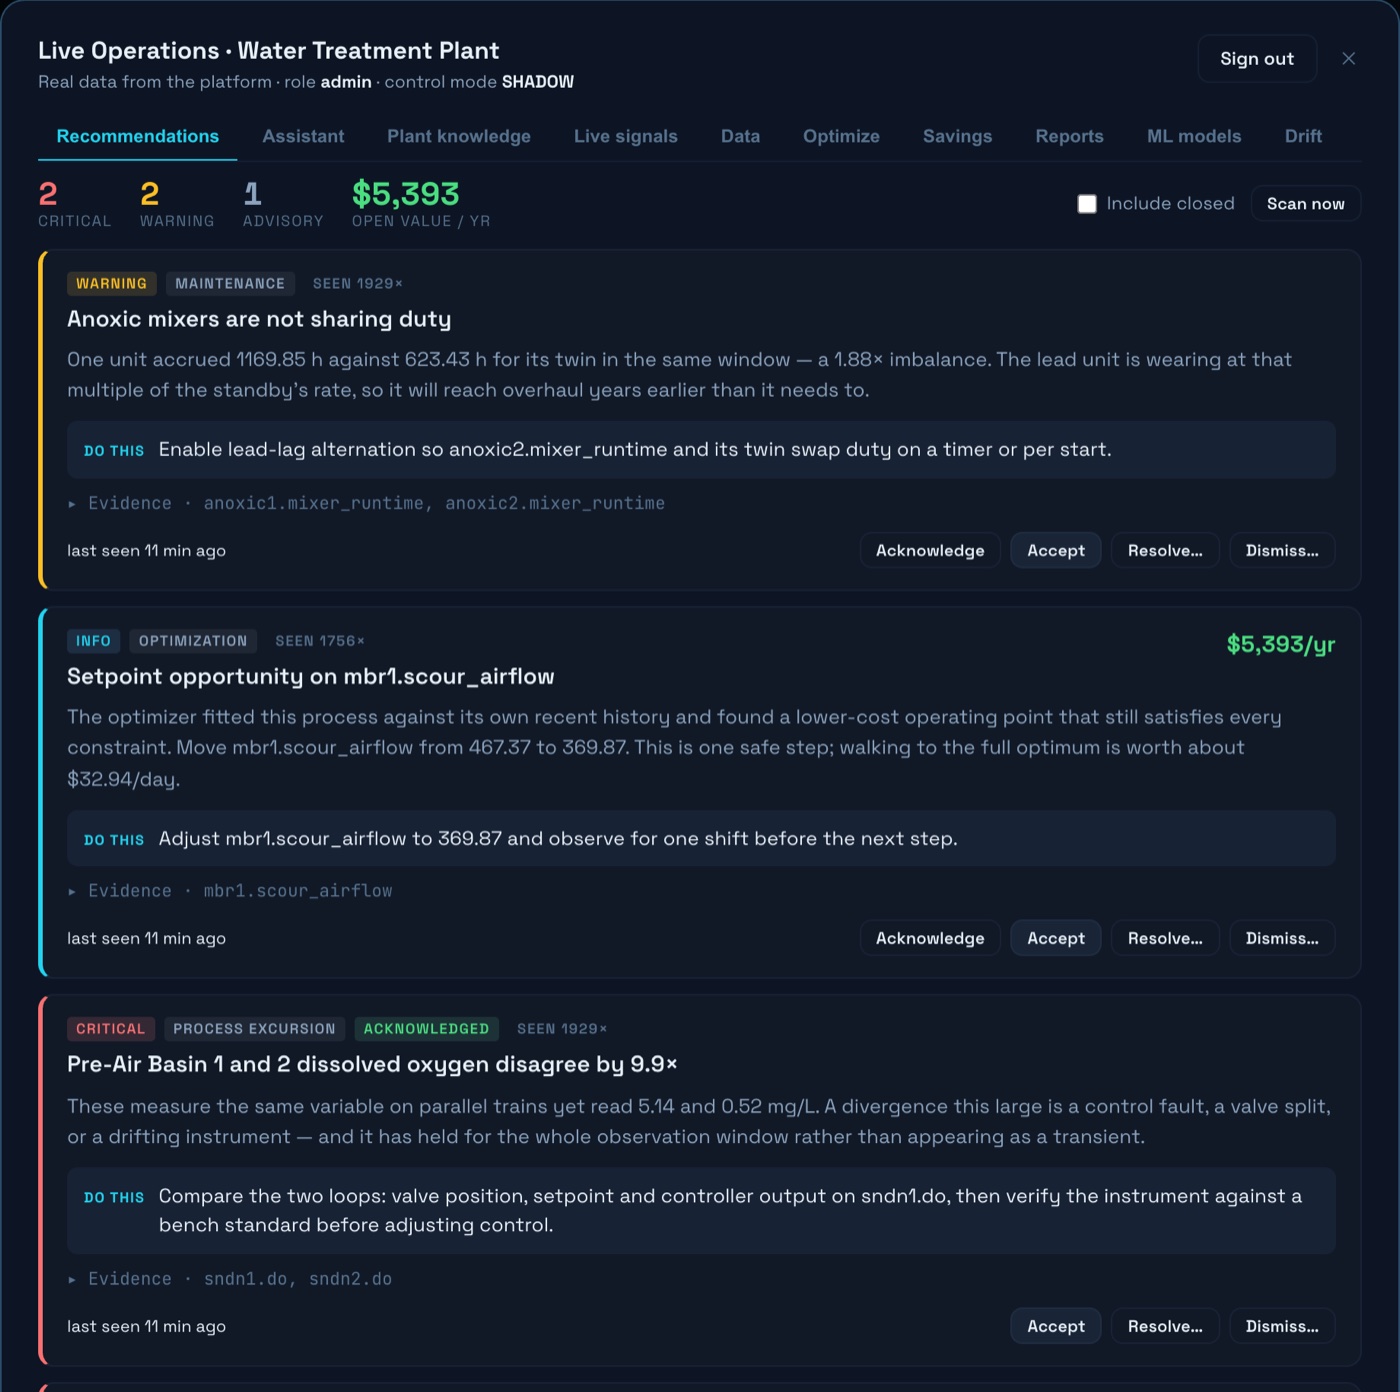
A ranked list of things to do, each with a number on it.
Not a dashboard to interpret. Findings arrive with the action, the tags that are the evidence, and what the change is worth a year — to accept, resolve or dismiss.
Working together
Built for your plant, not from a preset.
- 1
Free audit
On your BMS and water-treatment records, plus a make-up water analysis.
- 2
Your process, modelled
Modelled on your water and your equipment — the limit is different at every site.
- 3
Sensing where it pays
Most sites already have conductivity and flow. The audit says whether a probe adds enough to justify itself.
- 4
You stay in control
Advisory by default, clamped to limits your engineers set, every approval logged.
Start with a make-up analysis.
That and a month of tower records is enough to say what your data can and cannot answer.
Cooling figures are site-specific: the achievable limit depends on make-up chemistry, equipment and local discharge rules.