Food & Beverage
See what your water is carrying.
AquaMesh reads process and effluent water continuously, learns what your own product looks like, and connects a change back to what the line was doing at the time.
- Reads
- UV/Vis spectra, optional NIR, solids, turbidity, organic load
- Connects to
- SCADA, PLC, historian, LIMS, CIP and production records
- To start
- Existing data only — no new hardware
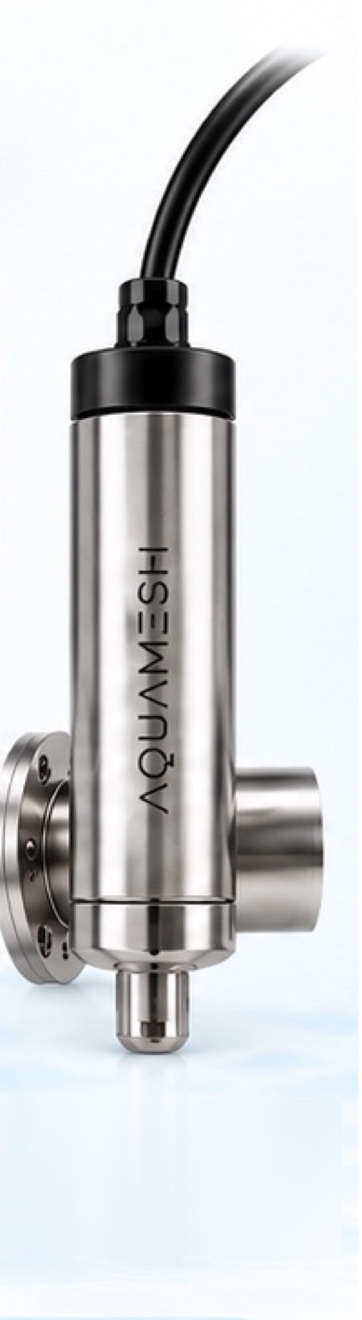
AquaSpectra™ smart probe
The sensor that can see your product, not just “organics”.
A single lumped number tells you something is in the water. AquaSpectra resolves the spectral signature, so a rise can be attributed to product rather than to cleaning chemistry or an unrelated stream.
- Product signature, not a lumped value UV/Vis with optional NIR separates starch, sugars, fats and dairy proteins from the rest of the load.
- Cleaning endpoint, observed Organics in the return line falling back to baseline is what “clean” actually looks like — measurable, rather than assumed at the end of a timer.
- Load visible before the invoice Organic load on the effluent line shows up as spectral change while the shift is still running — with BOD calibrated to your own samples where you need a number.
- Reagent-free and in place No sample line, no consumables, no reagent to refill — it reads the stream where the stream is.
- Reads for
- Product signature (starch, sugars, fats, proteins), cleaning chemistry, organic load and solids
- Typically sits on
- CIP and wash return lines, changeover transitions, effluent to sewer, recovery loops
What we find
Where a food plant usually loses money.
These four turn up in most plants we look at. The examples beneath each are the shapes they take in food and beverage — your own data decides which are real at your site.
-
Product leaving in the water
Yield that reaches a drain gets charged twice — once as lost product, again as load on the effluent bill.
- A cleaning cycle still running after the return line has already come clean
- Changeover flushes cut wider than the transition actually needs
-
Parallel equipment drifting apart
Units that should behave alike slowly stop, and nothing in the control system treats that as a fault.
- Twin separators carrying very different solids loads
- Duty pumps wearing at different rates because they never alternate
-
Setpoints inherited rather than chosen
A setting made once at commissioning tends to outlive the reason for it, and the person who set it.
- Refrigeration or air held above what the process asks for
- Large loads running straight through the expensive hours of the tariff
-
Instruments that stopped telling the truth
A dead or drifting signal never raises an alarm. It just quietly stops arguing.
- A flow totaliser that has not moved in weeks
- Two meters on the same stream that no longer agree
What you actually get
A ranked list of things to do, each with a number on it.
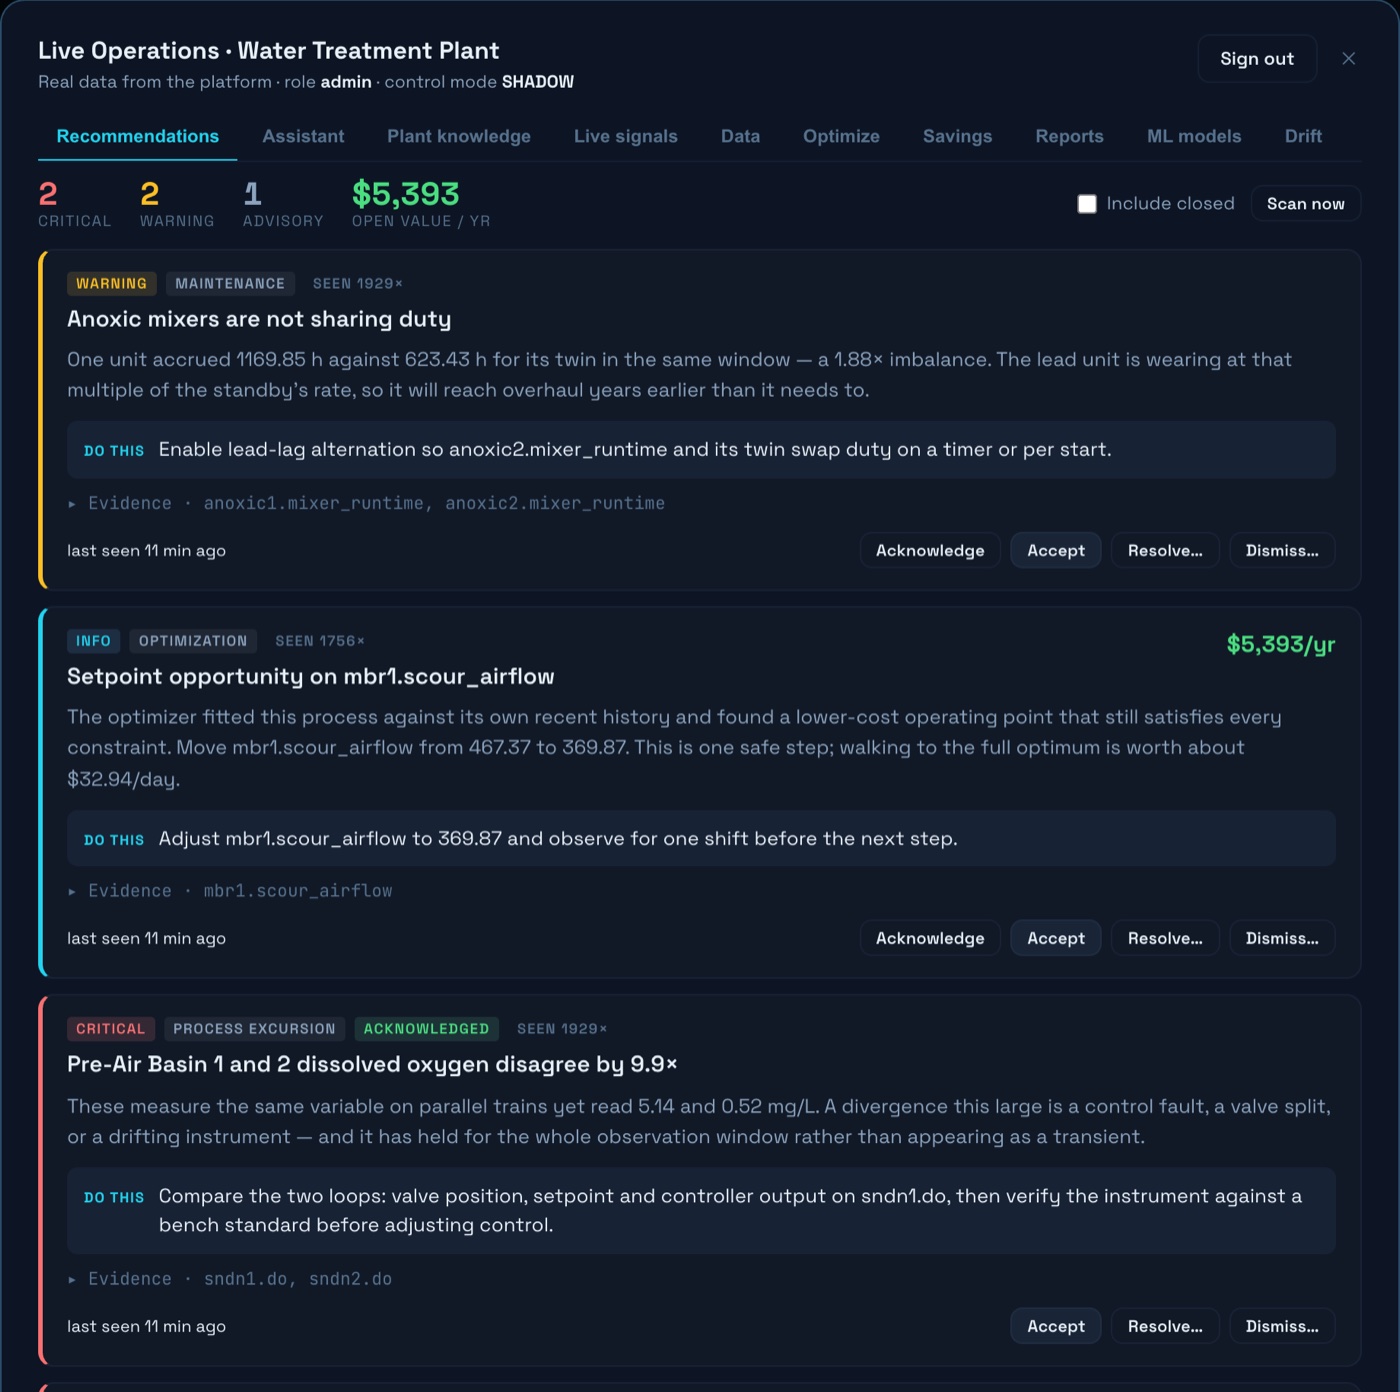
Not a dashboard to interpret. Findings arrive with the action, the tags that are the evidence, and what the change is worth a year — to accept, resolve or dismiss.
Working together
Built for your plant, not from a preset.
- 1
Free audit
On your historian export. No hardware, no install — you see the ROI before you buy.
- 2
Your process, modelled
Your own product is the reference. We build the model from your data, not from a library.
- 3
Sensing where it pays
One or two probes where your existing instruments are blind — not a network.
- 4
You stay in control
Advisory by default, clamped to limits your engineers set, every approval logged.
Start with one stream.
Pick the one you have wondered about. We will look at what your existing data already says about it.
Capabilities described here are general. What any of them is worth at a given site depends on that site’s process, tariff and existing instrumentation.